Dimensions of Data Quality
Spotify
Summary
Within Spotify’s internal data catalog, users were not engaging with the Data Quality indicator. By revamping the scoring system and its user interface, allowing a more nuanced interpretation, I improved the Data Quality’s page traffic by 2x.
Background

The adoption of Data Quality best practices within Spotify’s data ecosystem had been stagnating. From discovery research, we found that the existing scoring system didn’t match with data engineers’ mental models. Data Quality could have very different meanings in different use cases and the existing abstraction could not convey these nuances. Hence, data producers did not bother upgrading their datasets quality scores, and data consumers did not bother looking into these quality scores when shopping for datasets.

Previous Data Quality indicators: abstracted levels (1/2/3)The objective of this project was to revamp the Data Quality scoring system to better match users’ mental models, improving understanding and engagement.
Role
UI & UX Design – Turned insights into prototypes and high-fidelity designs
User Research – Conducted post-release user survey
Research
How do data practitioners think of data quality?
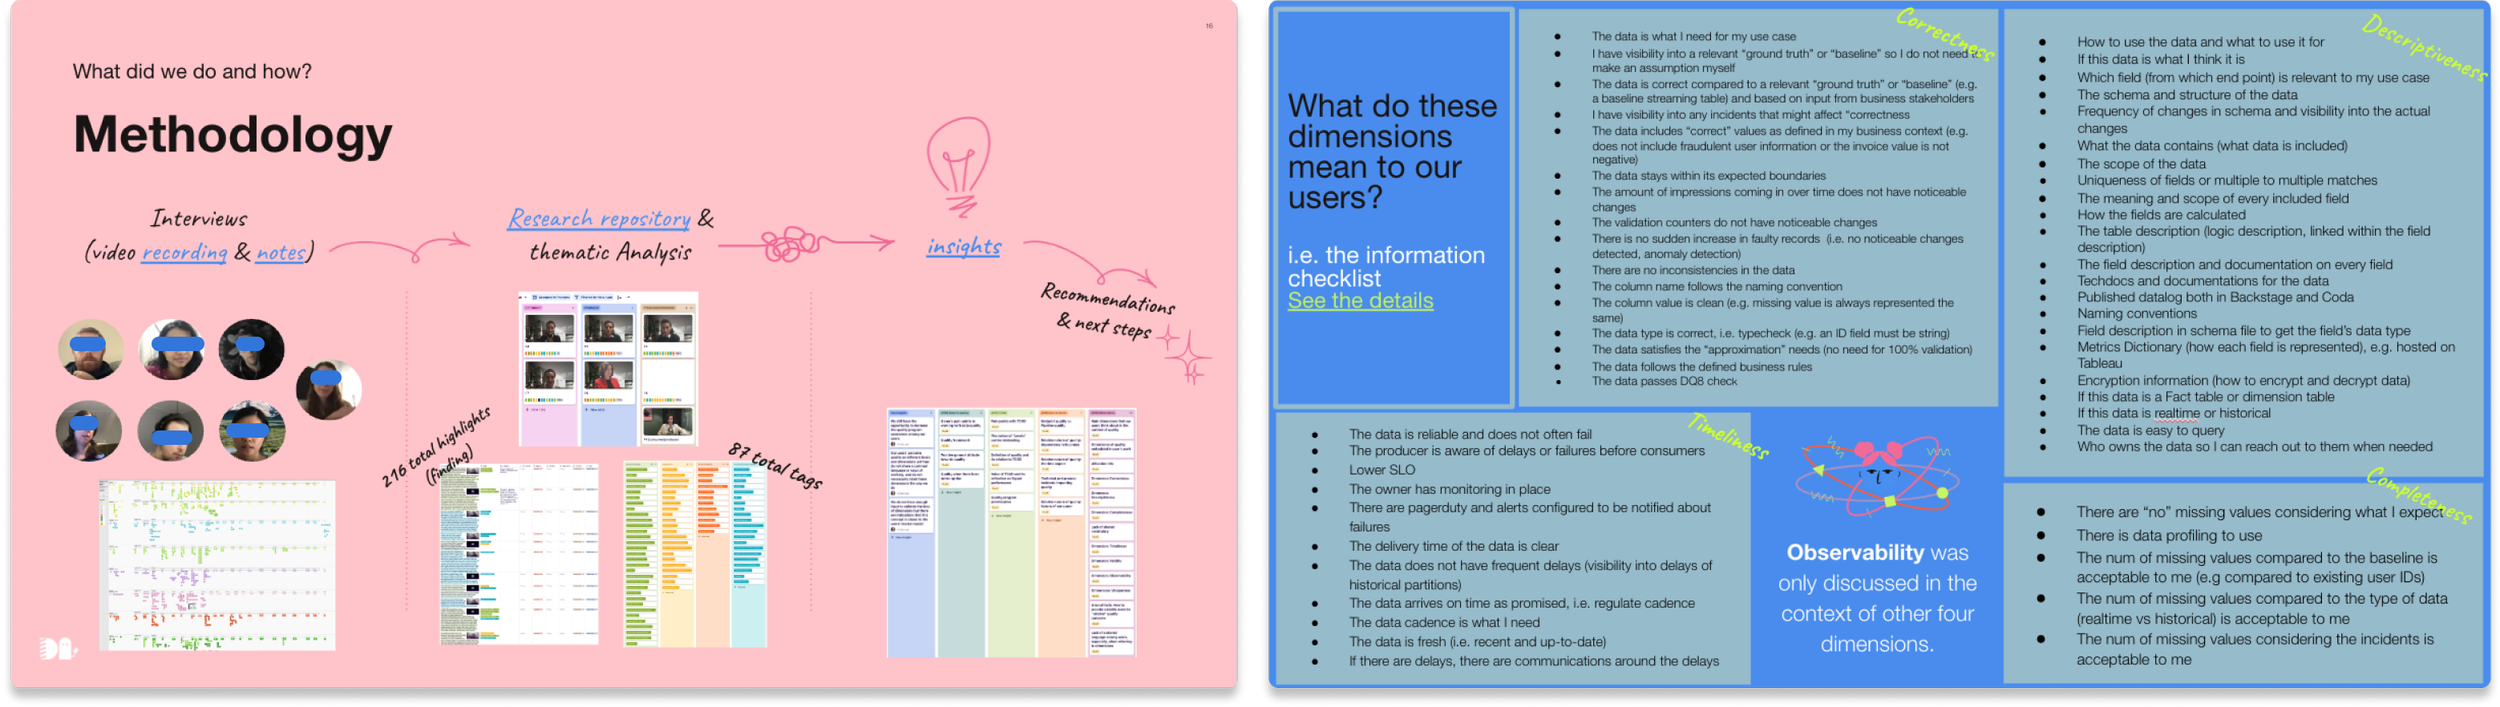
We knew from ad hoc feedback that the existing Data Quality indicators and checks are too rigid. For example, for financial data, correctness of data should be weighed heavier than having documentation. This nuance is lost in the current one-size-fit-all Data Quality scoring system. A series of user interviews and workshops were then conducted, collecting and categorizing different aspects of Data Quality across different functions of the business.
Design Outcomes
Flexible Scoring System via “Dimensions”
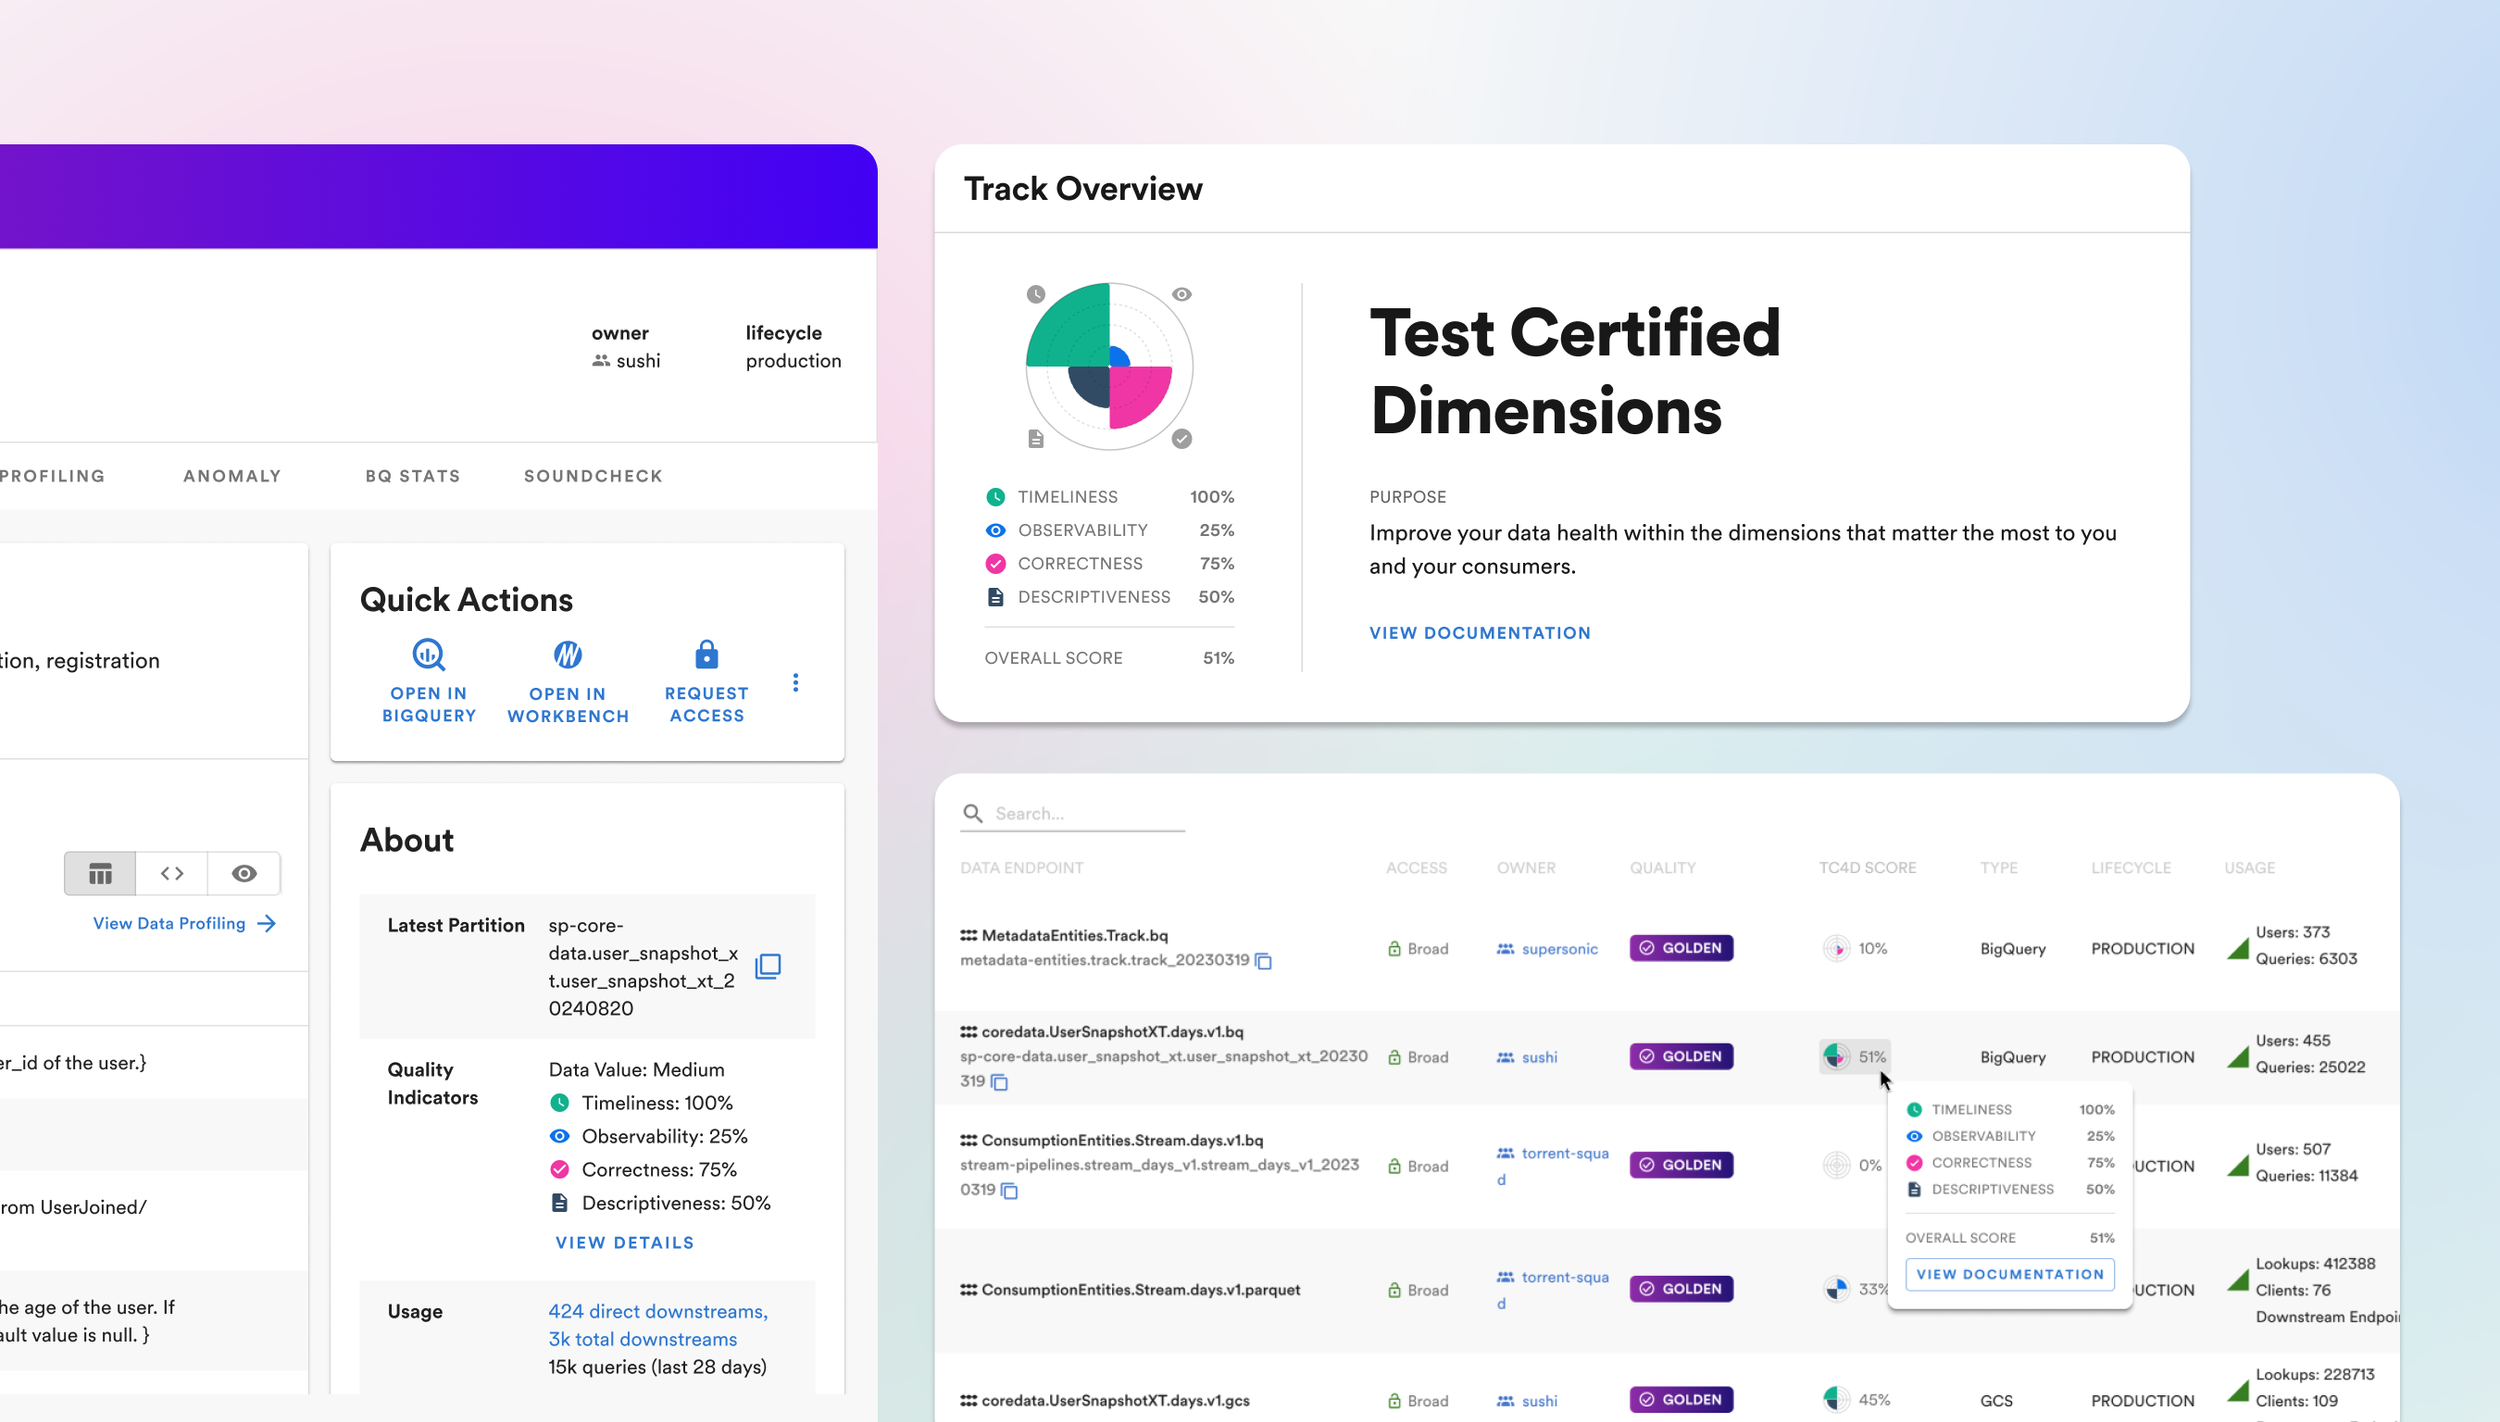
Using insights and categories we generated together with users, we designed a new scoring system that revolves around “dimensions”. Each dimension represents an aspect of Data Quality: Timeliness, Observability, Correctness, and Descriptiveness, with their own disparate scores. In this new system, data producers can focus on quality aspects that matter for their use case (e.g. correctness for financial data), and data consumers understand the nuances of a particular dataset’s quality.
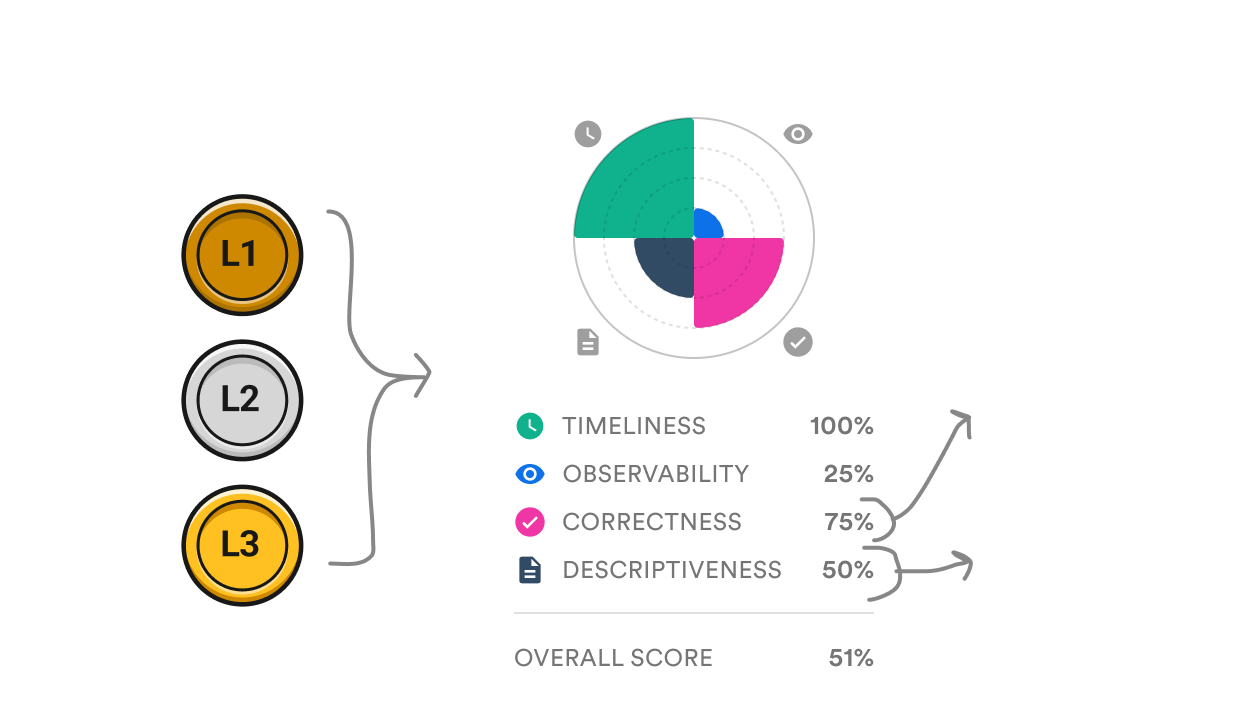
Discreet & abstracted “quality levels” are replaced by “dimension scores”Surfacing Data Quality Scores in Spotify’s Data Platform
By analyzing page traffic, we identified the most impactful touch points within Spotify’s internal Data Platform. On these pages, we added the new Data Quality Scores prominently.
Impact

Sustained increase in page traffic.
2x
Amongst Data Producers & Consumers, especially for users with high data proficiency.
Positive Sentiment
“This new scoring system allows me and my data consumer to negotiate data quality expectations more granularly”
–User Testimonial (Data Engineer)


