DevEx Metrics Dashboard
Spotify
Summary
Following a market opportunity brought by an industry shift towards AI tools, I led design and research for a developer productivity dashboard — helping middle managers demonstrate to executives that adoption of Spotify's commercial developer platform was delivering results.
Shipped to immediate commercial impact: cited in 75% of new deals and used by 60% of all accounts.
Role: Product Design, User Research
Type: 0→1 Product
Background
Spotify's Developer Portal was gaining traction and getting more customers, but our Champions (engineering managers at customer companies) were hitting a consistent wall. They needed to justify continued investment to their leadership, and they had no credible way to show ROI. Without that, trial conversion and renewals were at risk.
The AI productivity wave made this more urgent. Budgets previously frozen were suddenly available, but only for tools that could demonstrate measurable impact.
The opportunity: build a developer productivity dashboard that could be used by middle management to show exec-level leaders that the Developer Portal and their AI tools are working. Something that tells a story, not just displays data.
Getting Buy-In: Using AI to decide fast
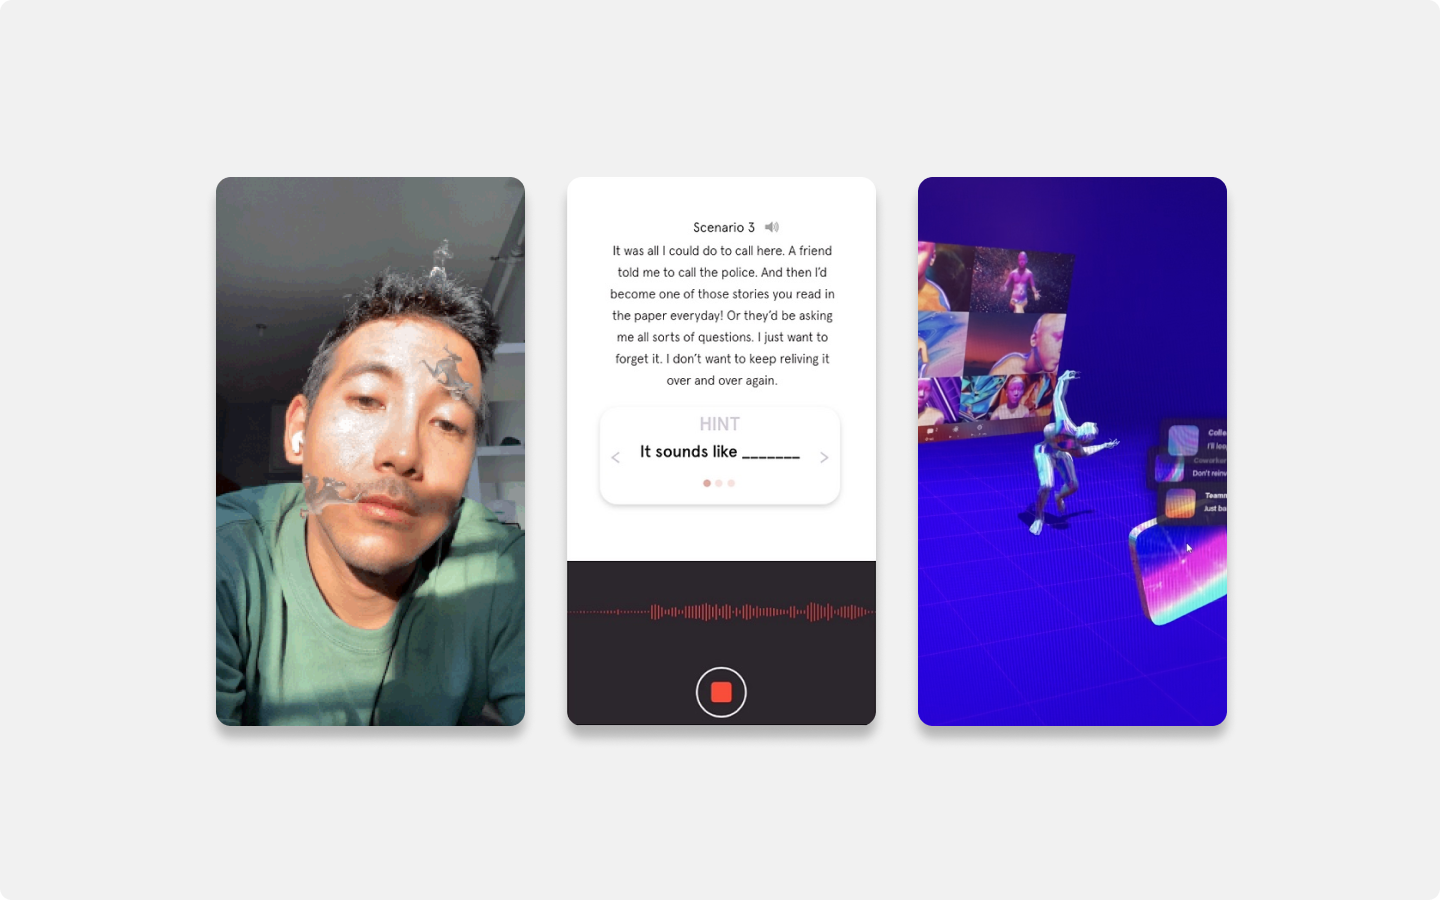
Before starting any design work, we needed leadership and engineering to align on whether the dashboard was worth building, and what a "dashboard” actually meant. I used AI-generated prototypes as conversation artifacts to get cross-functional alignment.
Using AI prototypes meant alignment sessions could be genuinely interactive. I could update the prototype in real-time as feedback came in, turning these into live working sessions. It let me align executives on vision, get engineering to commit to scope, and validate direction with customers.
Discovery
Learning from customers & experts
Measuring developer productivity is a domain most customers are not experts in, so customer interviews alone would not have been enough. I combined them with a review of existing productivity research and collaboration sessions with Spotify's own data scientists, so that customer needs were grounded in domain expertise from the start.
Here are the key takeaways:
Low onboarding tolerance
“Other productivity measurement tools in the market require really heavy manual setup” - Engineering Manager
Improvement > industry benchmarking
“The best teams achieve elite improvement, not necessarily elite performance.” - Google’s DORA report.
Transparency builds trust
"Metrics can be gamed — PR handling produces garbage outputs." - Engineering Director
Metrics without agency = anxiety
“Surfacing build time to a team with no control over their CI pipeline creates anxiety, not insight.” - Data Scientist
From insights to design goals
Based on the takeaways above, and filtered through time and resource constraints, I defined four design goals for this project:
01 Maximize first impression
02 Earn user’s trust
03 Allow for nuanced interpretation
04 Optimize for speed of shipping
Design Decisions
1) Out-of-the-box over completeness
We could only launch with 3 of the 4 DORA metrics, but I ensured the first thing users see is a dashboard with real & useful data, pulled automatically from existing API connections.
The first metric customers see always works out of the box; complete with supporting metrics, full historical data, and team-level breakdown
I also made a deliberate call to show all 14 metrics from day one, even if some of them require further configuration. Hiding them would have undersold the product's potential, whereas showing them reframes the experience from 'incomplete' to 'here's everything this can do’.
2) Nuanced view over AI summary
AI summaries were cut because there was not enough training data to do it responsibly, and in this domain, a wrong interpretation can do real damage. I validated an alternative approach with internal experts: pairing each core metric with supporting metrics so managers can investigate causes themselves rather than trust an automated verdict.
Stacking core metric & supporting metrics encourages users to visually investigate causes of improvement or degradation, allowing for more nuanced interpretations.
3) Customized views per metric
Rather than applying the same chart to every metric, I worked with internal experts to define an opinionated view for each one.
Deployment Frequency uses a time series for trend over time. Time to Recovery uses a histogram showing incident distribution alongside P75; more insightful than a trend line for a noisy metric. AI metrics use monthly granularity to make cost and efficacy comparisons across tools less noisy.
Chart type and time granularity are chosen based on what best surfaces the insight, not what is easiest to build.
4) Transparency via Learn More
Engineering managers need to present the numbers to people more senior than them. If they can't explain how a metric is calculated or where the data comes from, they won't use it.
Every metric has a Learn More panel showing its definition, data source, and calculation method — making it easy for managers to understand and defend the numbers before they walk into a leadership meeting.
5) AI-generated onboarding animations
For trial customers exploring without a guided sales demo, the onboarding needed to feel considered and not generic, eye catching yet still meaningful. I used Claude to generate abstract SVG animations that expressively convey what the dashboard offers, then pushed them to code myself using Cursor – creating a moment of delight before a user sees any real data.
Impact
75%
of new deals closed citing DevEx Metrics as a deciding factor (~1M ARR)
60%
of all accounts actively use the dashboard
“Something I wouldn't even have thought about — but it's a fantastic way to justify the platform's cost.”
Senior Director of Cloud Engineering
“The fact that it works out of the box! We've seen every other vendor require six weeks of setup and then show you a dashboard full of amber warnings you can't explain.”
Engineering Manager
More Case Studies

Canon Design System
Spotify

Data Pipeline Creation
ActionIQ
Software Scaffolder
Spotify